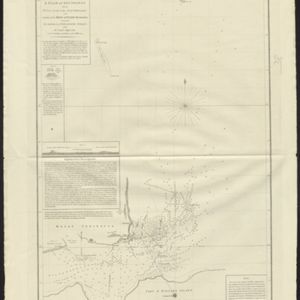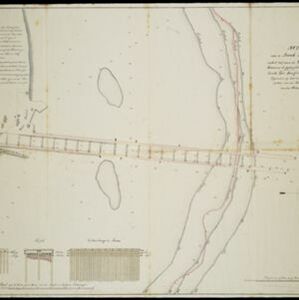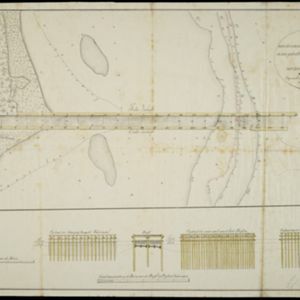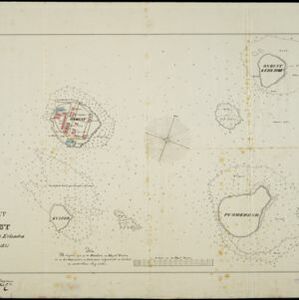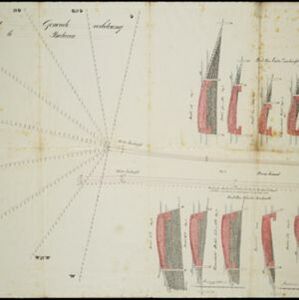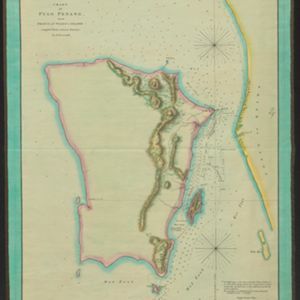
Chart of Pulo Penang: now Prince of Wales's Island
1805
Malaysia
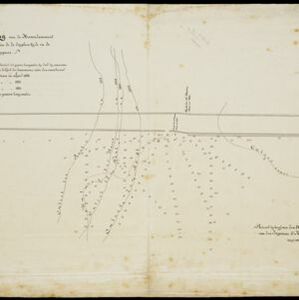
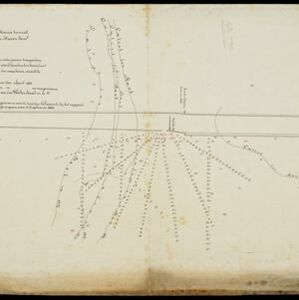
Map focusing on the passage between Penang Island and the mainland, with shoals and reefs marked and described, and bathymetry (sea depth) shown. There are anchor points at George Town harbour, and landmarks—hills, trees, a fort—to aid navigation.